
Innovative coverage of superstorm Sandy
October 30, 2012
First of all, we hope you are safe and that your loved ones are safe. Our thoughts and prayers go out to everyone affected by Hurricane / Superstorm Sandy.
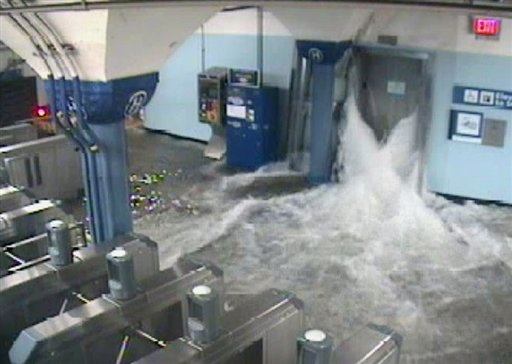
A PATH station in Hoboken, N.J. flooded in the storm surge of Hurricane Sandy on Monday, Oct. 29, 2012. (AP Photo/Port Authority of New York and New Jersey)
Natural disasters bring out many of the cliches of traditional media (reporters standing in the middle of a storm surge, photos of empty store shelves, and so on). But they also bring out some of the best and most useful work journalists perform for the public: keeping people informed about what’s happening in real time, helping them find local assistance, identifying dangerous areas to avoid, and telling those who aren’t in harm’s way how they can help.
With that in mind, we’ve been looking for the most innovative digital coverage of Hurricane Sandy. Here’s what we’ve found so far. Found something else? Post a comment below.
Local Resources and Grass Roots Media
- Jersey Shore Hurricane News: Operating completely on Facebook, this “bottom-up, two-way news outlet” is posting photos, videos and critically important aid information to people on the New Jersey coastline and many others who are looking for ways to help. It’s also serving as a community hub for people who are looking for missing people and lost pets. The site launched after Hurricane Irene in 2011 with 27,00 followers, and is already up to over 140,000.
- MTA on Flickr: The Metropolitan Transportation Authority that’s responsible for the New York subways and buses is posting photos of the transportation damage on its Flickr feed.
- The Hurricane Hackers group, a project of the MIT Media Lab that software programmers and data geeks are using to create new tools to assist during the aftermath of the storm.
- CNN iReport Sandy Damage Open Story: CNN-curated user videos of hurricane damage zones. Every video shows its location on a map to the side, and you can navigate through the map to find videos of specific areas. Users can also upload to the page, or from the iReport app.
Maps and Mapping APIs
- New York Times’ Power Outage Map: Shows power outages in and around New York City, with time graphs showing how many customers are without power. Updated every 15 minutes.
- The Guardian’s Sandy Map: The Guardian’s Data Blog is tracking and mapping verifiable events in Sandy’s aftermath. Every event includes a link to more info, and the ability to download full data as a Google Fusion table. (Thanks to our friends at the Center for Innovation in College Media for sharing this).
- Google’s Hurricane
#Sandy map showed the most recent hurricane cone prediction as it approached land, but also has other information layers — such as storm surge probability.
Live Coverage, Curation and Aggregation
- DigitalFirst Media’s Hurricane Sandy News: This topical aggregation page was going all day and night featuring the latest news from affected areas. It took wire reports, local reports, and combined them into one site.
- New York Times’ Sandy Webcam: The New York Times put a webcam on top of its roof and posted an updated picture every minute — now compiled into an animation. It provides a time-lapsed view of the storm over three days.
- Buffy’s World: Buffy Andrews of the York Record created several interesting and well-done slideshows on her blog using photos found via social media.
Data Visualization and Infographics
- Hint.fm’s Wind Map: A beautiful visualization of surface wind data from the National Digital Forecast Database, revised once per hour. Note that while the map uses real data, it should not be used for navigation, flight planning or anything mission-critical.
- New York Times Infographics: The Times also posted some good interactive infographics the morning after the storm.
- WNYC Flood Gauge: WNYC in New York had a real-time flood gauge, allowing people to see exactly how high the New York City rivers were in real time.
Creative Use of APIs, Data
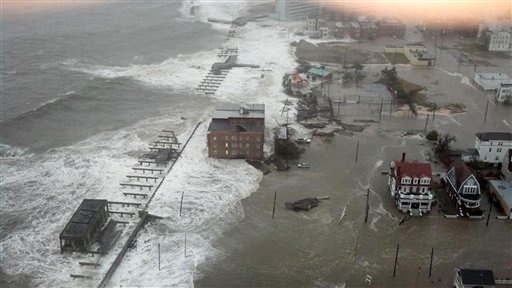
The Inlet section of Atlantic City, N.J. is flooded as Hurricane Sandy makes it approach on Monday Oct. 29, 2012. (AP Photo/6abc Action News, Dann Cuellar.
- Instacane: Instagram is growing in popularity as a news source in breaking news, as people are using it to share and post photos they take (rather than Flickr, Facebook or Twitter). This app allows users to create galleries of Instagram photos.
- The IRE News blog has a great post about how data journalists spread information about the storm.
- NJ.com #NJopen Twitter Feed: Sometimes the best innovations are also the simplest. NJ.com is using the Twitter API to pull in live tweets hashtagged #njopen and #njgas so residents can quickly find out where to get food, and where to get gas.
Fact Checking
- Poynter’s Fake Photo Tips: There were plenty of photos posted yesterday that were fakes, either new or recycled from other disasters. Poynter provided some good tips on how to spot a fake.
- The Atlantic also did its best to fact-check them and clearly label the fakes.
Noteworthy New Tools
- SeeClickFix: This app for iOS and Android lets you post problems that need to be fixed. The startup made its platform available for free to any media in hurricane affected areas to create widgets.
All photos on the main page linking to this post are courtesy of the Associated Press.
– Dan Pacheco & Brian Moritz.